It’s March! Spring is starting to show itself, Super Tuesday is here, and the February Portland Real Estate statistics have been published. What’s the news on the Real Estate front? Well, let’s talk about inventory first. Yes, a lot of people continue to struggle with low inventory – and there is a lot to be said for that, but it looks like it is improving.
For the record, these charts reflect Real Estate data in the city of Portland, not including any outlying communities.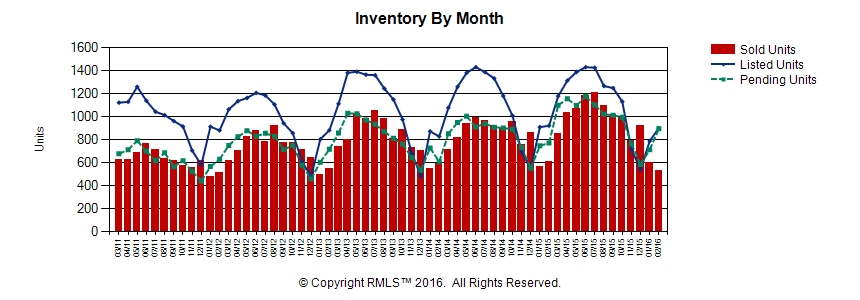
This chart is kind of small (my apologies to your eyes) but it reveals a couple of interesting things.
1) The number of listed properties in February increased by more than 100 since January and by more than 300 since December. Onward and upward!
2) This past year the gap between the number of listed properties and the number of sold properties was the smallest ever – implying that most things are actually selling. (Graphically this is shown by the gap between the red bars and the blue line.)
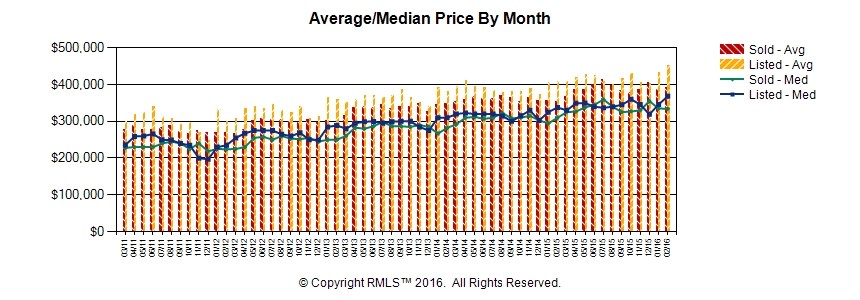
Not surprising, we can see here how prices in Portland have trended upward since 2011. The increase in the Avg/Median is approximately $100K, or approximately a 40% increase in value. Not a bad return on an investment, eh? 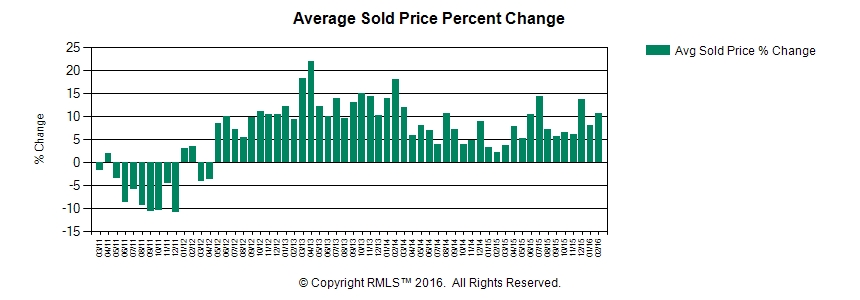
And this graph clearly shows how Portland transitioned from a buyer’s market (where sales prices were typically lower than the list price) in 2011 to a seller’s market which continues to today.
The moral of this story? I’d say that if you are a potential seller, life is good. At least for buyers there is one bit of good news: inventory is on the way.
1,571 total views, 1 views today