It was interesting to take a look at the inventory and sales price statistical trends over the past couple of years. If you talk to a Real Estate professional these days, something that is bound to come up over and over is the “lack of inventory.” Well… we’ve been in this trend for several years, so it seems. Take a look at this chart:
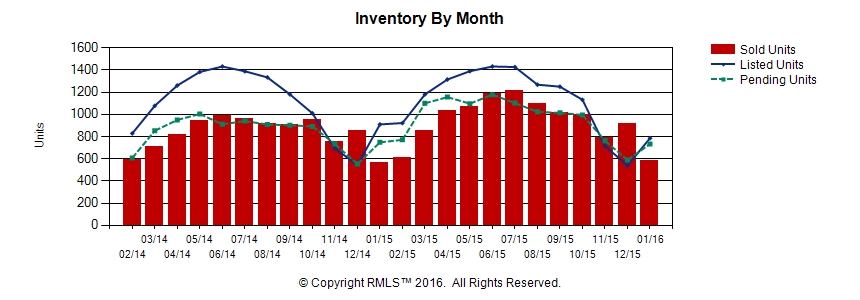
Yes – it’s true that inventory in January was crazy low – under 600, which is half of what we had this past summer. Add to that the fact that there were just under 600 closed deals in the city of Portland in January, that means we only have 1 month’s worth of inventory! The bottom line: if you are a buyer and you find something you like, don’t wait around. If you are a seller, it’s pretty likely you won’t go stale on the market, that is unless your price is out of whack or you have a very expensive home, in which case the story will likely be different.
Now look at prices over the past two years:
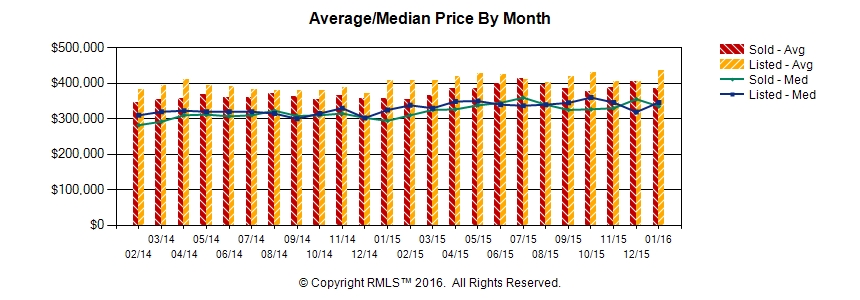
Although this chart makes it look somewhat flat, it really appears that we are talking about a 10% (roughly) increase over the past two years. Not outrageous, but not shabby either, from an investment point of view. I say that because that level of appreciation is well above inflation.
Questions/comments/thoughts about the statistics and the market, let us know! We love chatting about this stuff!
1,500 total views, 1 views today